Decoding Restaurant Accounting: For better cost control- Part 2 of 4

Decoding Restaurant Accounting: For better cost control- Part 1 of 4
April 8, 2019
Decoding Restaurant Accounting: For better cost control-Part 3/4
May 23, 2019
How many times have you checked your P&L to see “How were sales last month? last quarter? last year?” Most analysts take the annual, quarterly or monthly sales figures and compare them with budgets of previous periods, to identify the relative level of performance. But is this analysis of much significance? New studies suggest- may be not. An alternative method involves calculation of sales performance based on various ratios.
I will first discuss the concept of “sales efficiency”, which is much more than measuring absolute or relative change in sales over a period of time. For example, the assessment of how much revenue a table from the restaurant/cafe generates at different time intervals of the day or week can be quite useful. It will give valuable insights to the restaurant owners in running strategic sales programs to increase the sales during lean hours, thereby increasing the overall effectiveness of the restaurant. Efficiently managed restaurants put an additional effort to optimize seating arrangement and train staff to be more hospitable and up-sell to their clients. We have analyzed the impact of seating arrangement & efficiency in table management on revenue, by taking real life data of a restaurant’s 2nd Quarter data of 2018.
For the purpose of understanding the numbers – the three locations are having areas of 2965, 4635 and 3368 Sq. ft respectively and a seating capacity of 74,107 and 86 respectively and are a franchisee of a National Burger Serving QSR in the US.
SALES PER SEAT AND REVENUE PER PERSON
[visualizer id=”11569″][visualizer id=”11565″]
Sales per seat is the total monthly sales divided by the total number of available seats in the restaurant. The sales per seat in 2nd quarter of 2018 is highest in Location 1 ($5943.93), followed by Location 3 ($5754.23) and Location 2 ($4840.14). Now what is vital is to correlate these figures with the total guest count. Low income per seat with low guest count shows that the restaurant is not being able to attract an adequate number of customers. Low income per seat combined with high guest count shows that average ticket sales is suboptimal. Therefore, the restaurant owner should find ways in which they can make the purchasing of additional items, services or goods more enticing for his customer base, through marketing campaigns, better menu design or development, or other similar plans. More in-depth analysis of the hourly sales data can help to focus strategies like happy hours to increase the average sales per hour.
SQUARE FEET PER SEAT:
[visualizer id=”11575″]
The square feet per seat measure efficiency of space management of a restaurant. This number is higher for Location 2 branches (43.01 per sq. feet) than Location 1 (39.67) and Location 3 (39.06). Location 2 is losing out approximately 10% of generatable income because of inefficient seating arrangement. The restaurant owner may think that he will be able to fit 100 people, however that may be against their local fire code. It is also vital to note that it might be a conscious attempt of the restaurant to have a high square feet per seat ratio to show a certain image. For example, many fine dining restaurants have spaced out seating arrangements to avoid giving the diners an overcrowded messy feel. In such restaurants, generally the high revenue per seat compensates for the high Square feet per seat.
SALES PER SQUARE FEET:
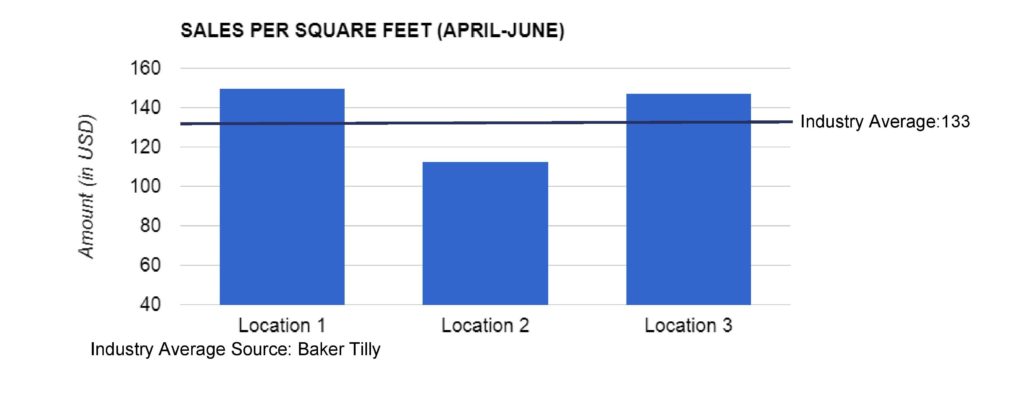
Sales per square feet is the most reliable indicator of a restaurant’s potential for profit. The area of the restaurant is the total interior square footage including kitchen, dining, storage, rest rooms, etc. This is generally equal to the net square feet rentable in a leased space. In this instance, only location 2 is having its value below the industry average because of its high square feet per seat value.
In the next segment of this 4-part restaurant accounting and analytics series we will take up another innovative criteria, income per seat hour. Restaurants are characterized by predictable seasonal factors and unpredictable individual customer demand, which make it difficult for restaurant owners to attain effectiveness. Many studies have been undertaken and it has been concluded that one of the major factors affecting the success of the restaurant is Revenue per Available seat.
Instead of simply running the restaurant, it is time to run it smart, for which good analytics and a customer focused approach is a must. The rate at which this space is growing, it will be difficult for laggards to survive. Fruxient Accounting provides a reliable, accurate and cost-effective accounting and analytics solution to ensure scalability, efficiency, keys to customer satisfaction and above all, increased revenues.
Click here to know more about our services for the restaurant industry.
